“Respect your elders”
These words echo through the years of many of our childhoods. There was a time, not so long ago, when the elderly were the most readily available, if not the only source of “big data” available, to most of humanity. While our minds are arguably not designed to think on a global scale (we are just animals with fancy brains, after all), our species has continuously made it a point to circumvent this limitation. Books, maps, oral histories, pictographs, the printing press—all brilliant and pointed reminders that our species demands to be understood as more than the sum of our parts. Now, however, we have a whole new tool kit. For the first time our understanding of planet earth can stretch far beyond distorted 2D renderings of our planet, and even beyond Google’s tantalizing 3D rendering of our favorite oblate spheroid.
Have you ever thought about how your Google Maps navigation system works? All Apple devices that have the maps app open, and all Android devices with location services turned on, are telling Google what the world looks like. Google gathers data not only from all of us, but also from your local Department of Transportation, traffic history, and a multitude of other sources to create a structure of complex models that result in the reassuring words “you’re on the fastest route.” While Google uses these methods to get you to work on time, the very same technology presents humanity with incredible opportunity and incredible risk: What happens when you give the human race the ability to see in 4 dimensions?
Geographic Information System (GIS)
Google maps is one example of a Geographic Information System (GIS). We use these everyday: Google Maps, Trip Advisor, Kayak, Snapchat, Facebook, Craigslist. Whether you want to know where your friends are headed tonight or to check if the restaurant that you’re meeting your coworker at for lunch is busy, GIS is effortlessly woven into our daily lives. There is much more depth to this technology than a fancy map, however.

Take any place. We’ll use the district of Comas in Lima Peru: Length, Width. Then take a data set: drinking water. Then layer on sewage systems, types of electricity access, tap water access. There you have height. With just that you can start to make a number of complex inferences. Then imagine taking this map and stretching it, like the skin of a drum, across a 20-year period. Suddenly you have a bird’s eye view of a place’s history. You can see how things have changed, and with enough data, you can see why. And finally (mind you this is already happening), you can start to draw more and more accurate pictures of what comes next. Though our reductionist understanding of the world currently limits our ability to accurately peer into the future, the more we gain an understanding of the complex relationships that define the interconnected world we live in the more accurately predictive this technology will become.
Mapping the Future
In planning a permaculture design project or any biodynamic design, every aspect of a place’s identity must be considered and respected—the water, the air, the soil, the flora, the fauna, the climate, to name a scant few. Understanding the true context and character of a place requires detailed observation over time; this is the phenology of a place. Because of the variety and complexity of the variables that must be taken into account in a permaculture, or any biodynamic design, GIS is an obvious aid in these creations.
Not only can GIS create a visual and visceral representation of the data collected in a phenological study, but the visual representation of the collected information can begin to elaborate on the dynamic complexity of an environment. For example, you might be able to see that a certain plant is thriving in one section of your design and starving in another. Over the course of a month or a year, you might take note of a slight shift in population density from one place to another. Utilizing GIS, one could see this shift in population on the map, over time, and begin to investigate the factors that lead to such a change.
Magnify that by all the data that you collect, basic topographical data, perhaps some previously existing survey data, and getting in-depth pictures of the nature of an ecosystem becomes a different task entirely.
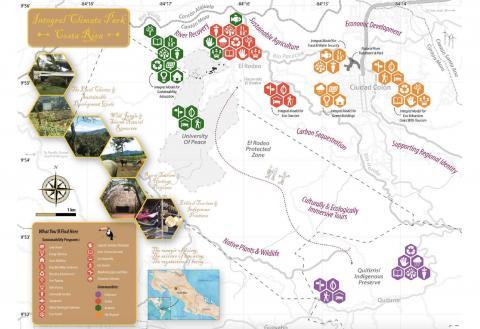
A phenomenal example of the utilization of this technology is in the collaborative geodesign project being built in the San José province of Costa Rica, about 30 minutes outside of the capital city. The United Nations University for Peace; Integral Climate Change Solutions; City Sandora: A Design Collective; and the Earth Charter Initiative are collaborating on what is being called an Integral Climate Park. This is a large-scale biodynamic sustainable design, incorporating a diversity of cultures and acting as a scalable model for sustainable community design. They have been using GIS to effectively map, plan, educate, and learn about the benefits and challenges facing this project on every level. As they expand and learn how to integrate the strengths of each involved community into the climate park, their mapping models expand to include not only ecological and topographical features, but features that address the diverse resources of each.

Zooming Out
GIS is widely applicable in almost every field of research and science. In fact, the previously mentioned predictive GIS is something that is finding itself implemented not just in science but in government as well. Predictive smart maps, otherwise known as predictive AI, are being used to do everything from determine welfare eligibility across Indiana, to determine child welfare risk in Allegheny County, Pennsylvania. Unfortunately, the determining algorithms often times find themselves trained off of incomplete data sets, leading to unintentional biases ingrained in certain programs. The previous two examples are actually in reference to a book titled Automating Inequality. The wielding of Big data (yes, with a capital B) is certainly a difficult issue, especially as a technology that arguably has some of the most far-reaching implications for our globalized world. To unquestioningly embrace it or to condemn it would be like doing to the same to the general idea of knowledge or technology. Big data, like knowledge or technology, is not something that is inherently positive or negative; the only connotation that can honestly be lent to it, good or bad, is that of our collective social conscience. How we wind up using it is up to us.